Poker Card Game Simulator Using Python
Poker Card Game Hand Simulator using Python
 Image from Don’t play the cards, Play the people</br>
This is part of python learning experience with matplotlib, numpy and scipy.
After losing lots of money on poker game, what? yeah I said in iPhone games, it was an attempt to analyse the probability of winning the money back.
In poker, players construct hands of five cards according to predetermined rules, which vary according to which variant of poker is being played. These hands are compared using a hand ranking system that is standard across all variants of poker, the player with the highest-ranking hand winning that particular deal in most variants of poker. In some variants, the lowest-ranking hand can win or tie. List of poker hands
For more details about the poker hand ranking, refer the above wiki link.
I use the following abbreviation for each poker hand rank to display the data.
 P 	  --> One Pair        : Two cards with the same rank </br>
 TP   --> Two Pair        : Two pairs of cards with the same rank</br>
 3K   --> Three of a Kind : Three cards with the same rank</br>
 S    --> Straight        : Five cards with ranks in sequence</br>
 F    --> Flush           : Five cards with the same suit</br>
 FH   --> Full House      : Three cards with one rank, two cards with another </br>
 4K   --> Four of a Kind  : Four cards with the same rank</br>
 SF   --> Straight Flush  : Five cards in sequence and with the same suit</br>
 SNL  --> Sorry, No Luck </br>
Initially I started to to code the poker hand simulator based on some text book, when I saw the output which is almost close the theoretical value, I got the idea to plot the values using some python plotting libraries as a learning experience. Wow, the data analysis with python is awesome with powerful libraries like matplotlib, numpy and scipy. You can refer the source code here.
The following results are based on following conditions,
- For each shuffling, distribute 7 cards per hand for 7 hands.
- Check each hand's rank at first time before moving any cards.
- Repeat the shuffling for 10000 times and accumulated result was taken.
- Use the python's random.shuffle() api for shuffling the cards.
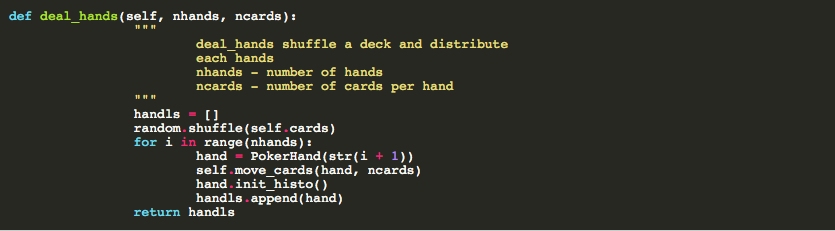
Shuffle a deck of cards to each hands.
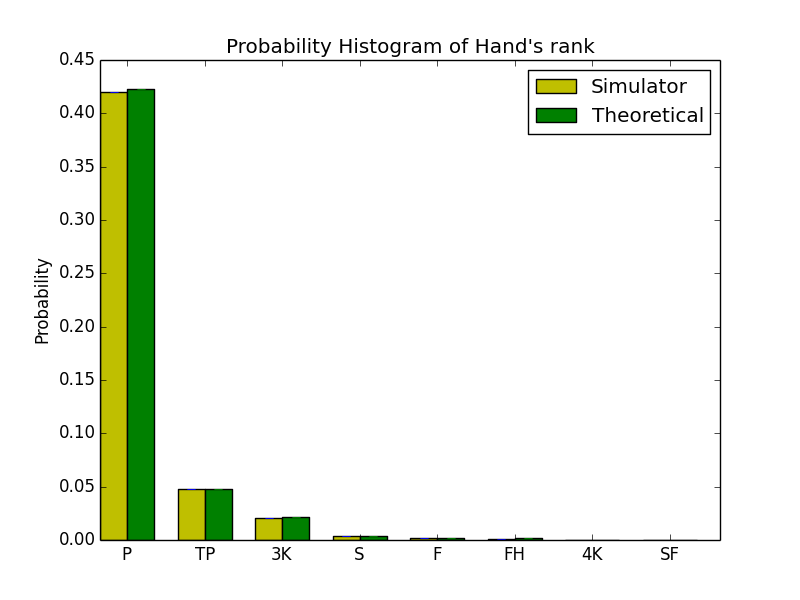
Following Bar chart and and Pie chart show the probability of each hand’s rank after 10000 times of card shuffling.


The following chart shows the consistency of the above result. I tried to repeat the same
test for 10 times, the result was almost identical.

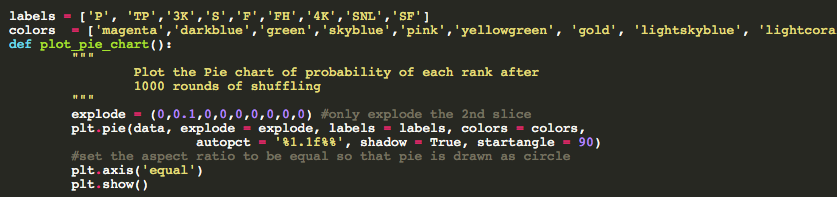
Code to plot Pie Chart using MatplotLib
In order to verify the simulator result with existing theoretical value, I repeated the
test with 5 cards per hand. After 10000 times of shuffling, following result shows the
comparison. Refer this link for theoretical values Hand’s Ranking.